Get stock prices into Excel — without writing code
No API key, no Python, no copy-paste. Two clicks on any Yahoo Finance page turn a year of price history into a clean CSV that opens straight in Excel, Google Sheets, or Numbers.
Three steps, two clicks
Open any stock on Yahoo Finance
Look up a ticker on finance.yahoo.com the way you always do — stocks, ETFs, indices, or crypto. The purple FinGrab button sits in the top-right corner of every quote page.
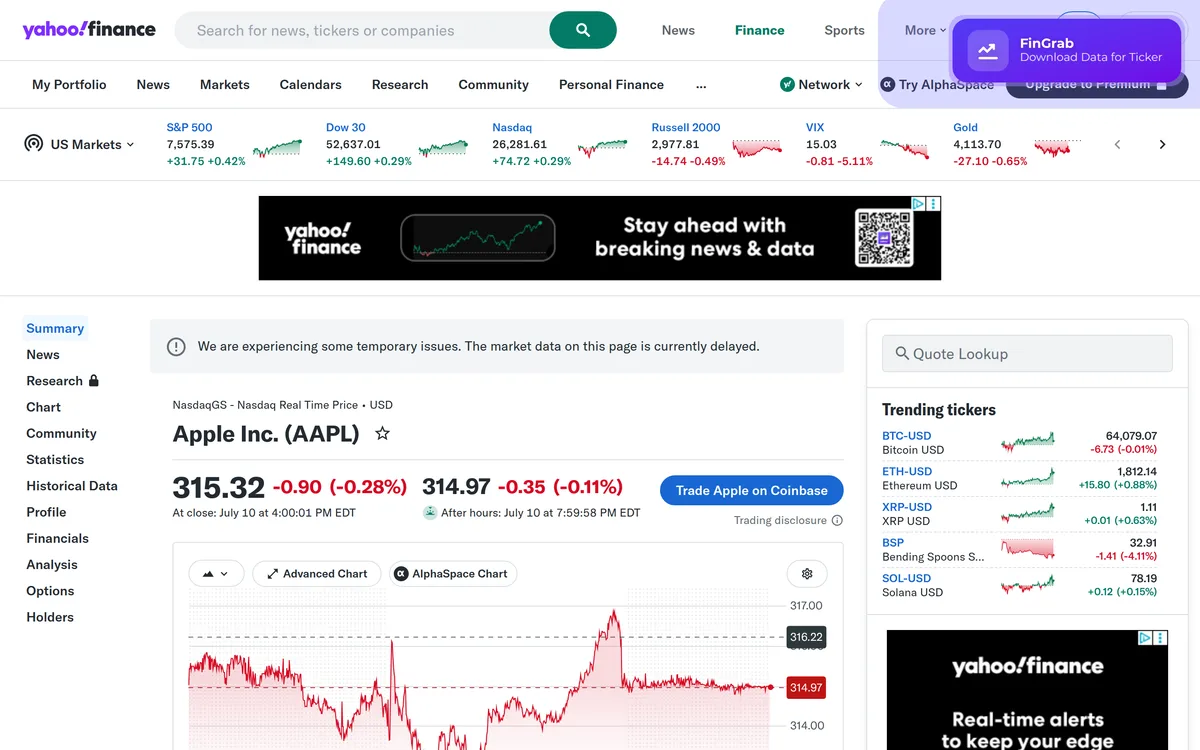
Click it — the ticker is already detected
The export dialog opens with the symbol filled in. Pick a time period — six months up to maximum history, all of it available on the free exports too — and an interval: daily, weekly, or monthly candles. The data is fetched directly from Yahoo Finance and processed locally in your browser.
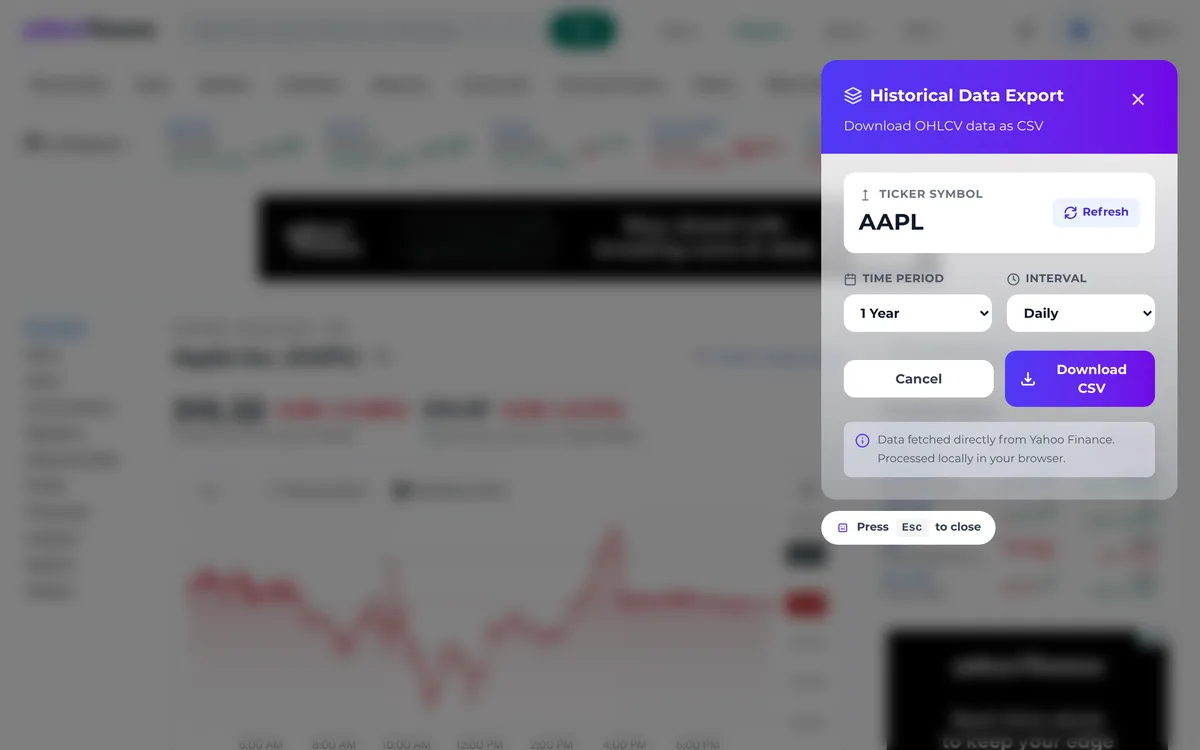
Download CSV — open it in Excel
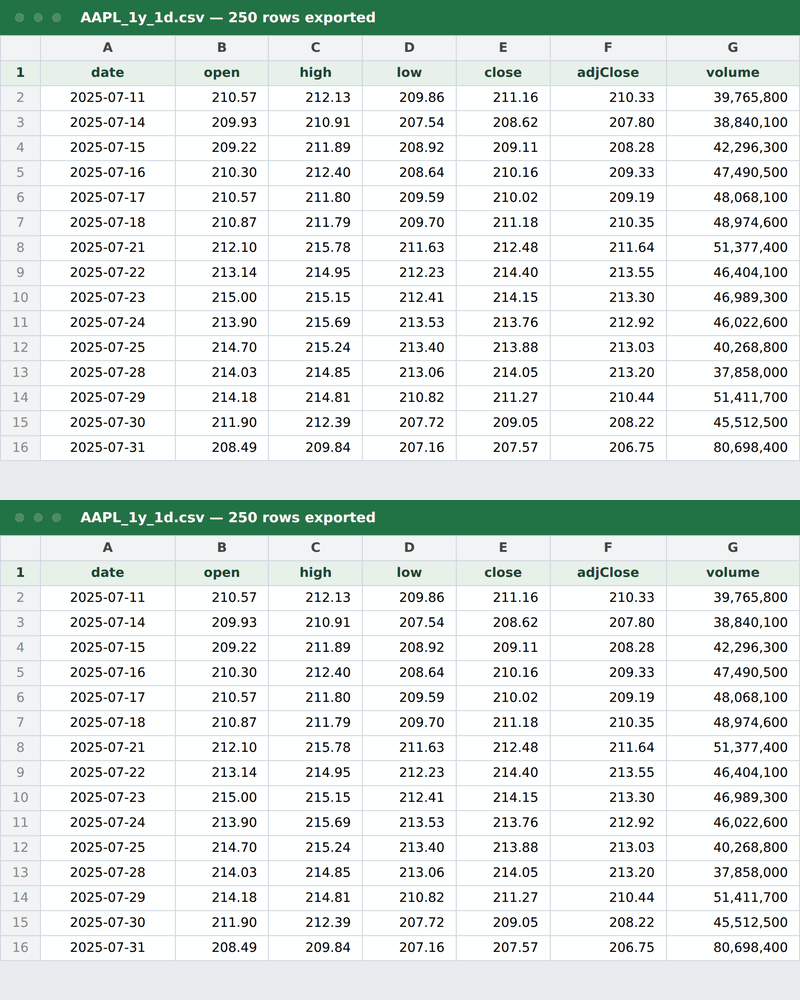
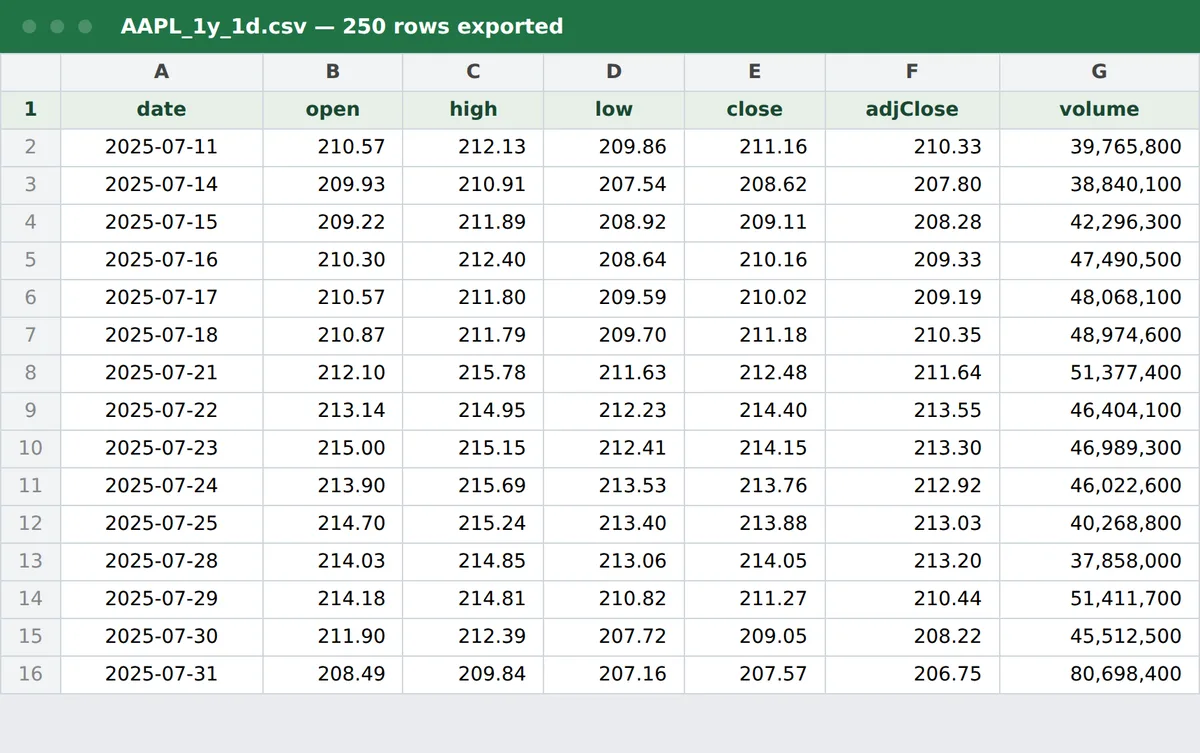
One more click and the file is in your downloads folder, named like AAPL_1y_1d.csv. Double-click it and Excel opens a clean table: one row per trading day, seven tidy columns, no cleanup needed.
What lands in your spreadsheet
A plain CSV — the file format every spreadsheet opens natively. One row per trading day (or week, or month), ready for formulas, pivot tables, and charts.
OHLCV + adjusted close
date, open, high, low, close, adjClose, volume — the columns every analysis starts from.
Splits & dividends handled
The adjusted close column accounts for splits and dividend payouts, so long-range charts stay honest.
Daily, weekly, monthly
Choose the candle size that fits your model — from day-trading granularity to decade overviews.
Any Yahoo Finance ticker
Stocks, ETFs, indices, currencies, crypto — if it has a quote page, it exports.
Opens everywhere
CSV is native to Excel, Google Sheets, Numbers, and OpenOffice. No import wizard needed.
Local processing
Data goes from Yahoo Finance straight into your browser and onto your disk. No account, no middleman server.
The other ways to do it
All of these work. They just assume tools or patience you may not have.
Copy-paste from the Historical Data tab
Free and obvious, but you get a page at a time, the formatting breaks on paste, and you redo it every time the data updates. Fine once, painful weekly.
Excel’s STOCKHISTORY function
Elegant if you have it — but it requires a Microsoft 365 subscription, covers fewer tickers than Yahoo Finance, and leaves you inside Excel’s data types rather than a plain portable file.
The yfinance Python library
The right tool if you already write Python. If you don’t, it means installing Python, learning pandas, and debugging scripts — a big detour when all you wanted was a CSV.
Financial data APIs
Powerful for apps, overkill for spreadsheets: API keys, request limits, JSON parsing, and often a paid tier before you get meaningful history.
Frequently asked questions
Is FinGrab free?
You get 5 free exports — no signup, no credit card, and every time range from six months to maximum history is open on them. If it earns a place in your workflow, Pro lifts the export count.
Do I need an API key or a Yahoo account?
No. FinGrab reads the data for the quote page you are on, directly from Yahoo Finance, and processes it locally in your browser. There is nothing to register and no key to manage.
Which tickers does it work with?
Anything with a Yahoo Finance quote page: stocks, ETFs, indices, currencies, and crypto. The button appears on every quote page automatically.
What exactly is in the CSV file?
Seven columns — date, open, high, low, close, adjusted close, volume — with one row per interval (day, week, or month) over the time period you picked.
Does it work with Google Sheets?
Yes. CSV is a universal format: upload the file to Google Drive or use File → Import in Sheets, and it lands as a clean table, same as in Excel.
Try it on the next stock you look up
5 free exports to see if it fits your workflow. No signup, no API key.
Add FinGrab to Chrome